
Study overview
Every year since 1990, a survey has been run by the Center for Behavioral Health Statistics and Quality to gain a deeper understanding on drug abuse across ages.
This data is used to help inform drug and alcohol prevention programs, as well as understand behaviours and traits of users over time.
My data set
I was given this data set for one of my Data Science Immersive projects with General Assembly and asked to perform Exploratory Data Analysis (or EDA), with the objective of discovering a relationship or further questioning that could be evaluated using hypothesis testing.
In hypothesis tests, we can determine if there is no effect (the Null hypothesis) versus there is an effect (the Alternative hypothesis). There is a number of statistical tests that can be employed to check if the Null hypothesis can be rejected, I’ll talk through my hypothesis and what I used to determine if I could accept my Alternative hypothesis further along in this post.
One of the first things I noticed was that it had been summarised, with participants grouped in age buckets, usage numbers provided as percentages of the sample size and frequency given as the sample median.
This did, for a short while, annoy me a little bit. I am interested in these kinds of analysis generally and knew that it would limit the level of analysis that I wanted to perform. But I quickly recognised that it focused my analysis on areas of importance and stopped me from getting too caught up in the story of the individuals that had completed the survey.
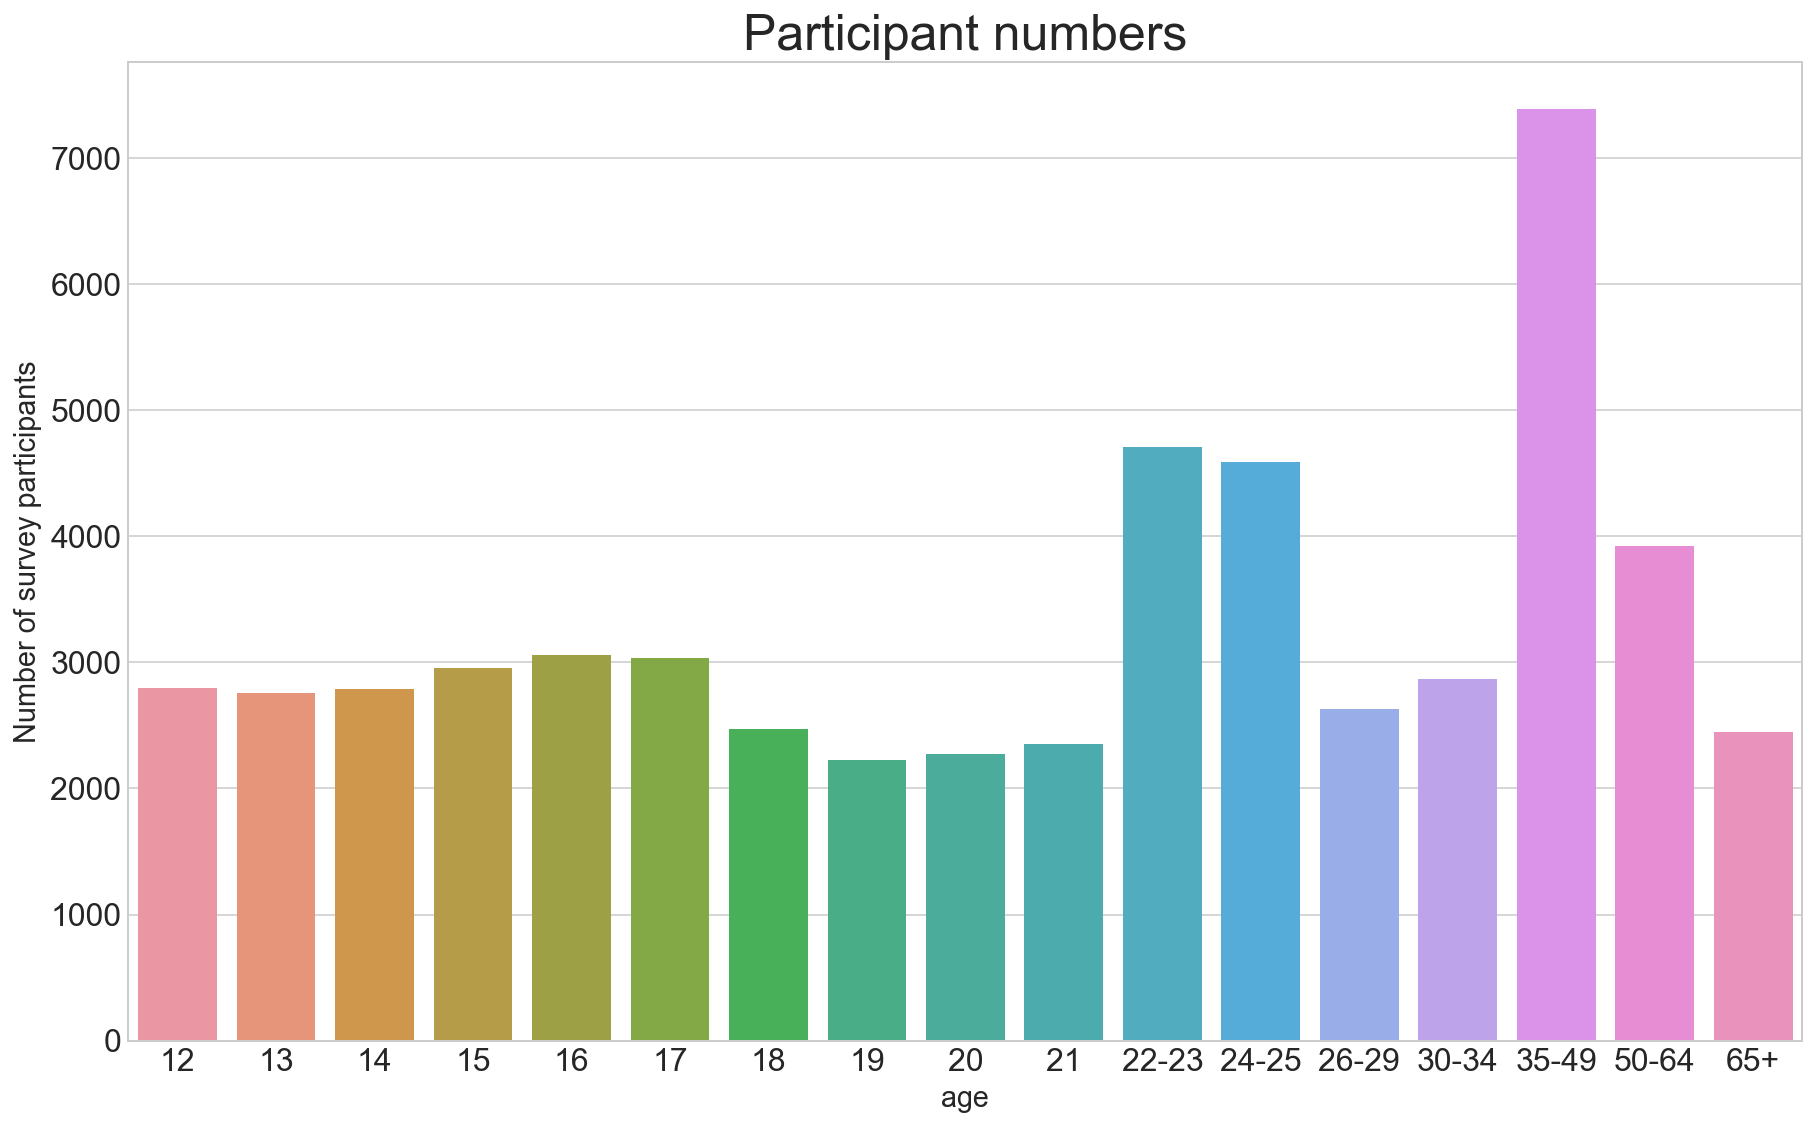
The sample population
I quickly realised the reason that the data set had been summarised. Youth, ie. participants between the ages of 12 and 21, are at the centre of this summarised data, with each age group having their own observation line within the data.
From 22, the age groups start to be combined, small ranges at first but this increases dramatically, the older the age group.
One limitation I called out from the start was that by grouping in such as way, some age groups at different stages of life are grouped together. For example, people between the ages of 35 and 49 are grouped together in this data set. Different stages of life and varying experience could result in different drug habits.
EDA and shaping my hypothesis
During my initial review of this drugs data, I created a correlation matrix using the Spearman correlation coefficient. The matrix was huge because there are so many drug categories and that made it difficult to read, so I decided to plot the correlations on a heatmap. I thought this was a nice way to see if there’s anything interesting to be learned from the correlation of each drug.
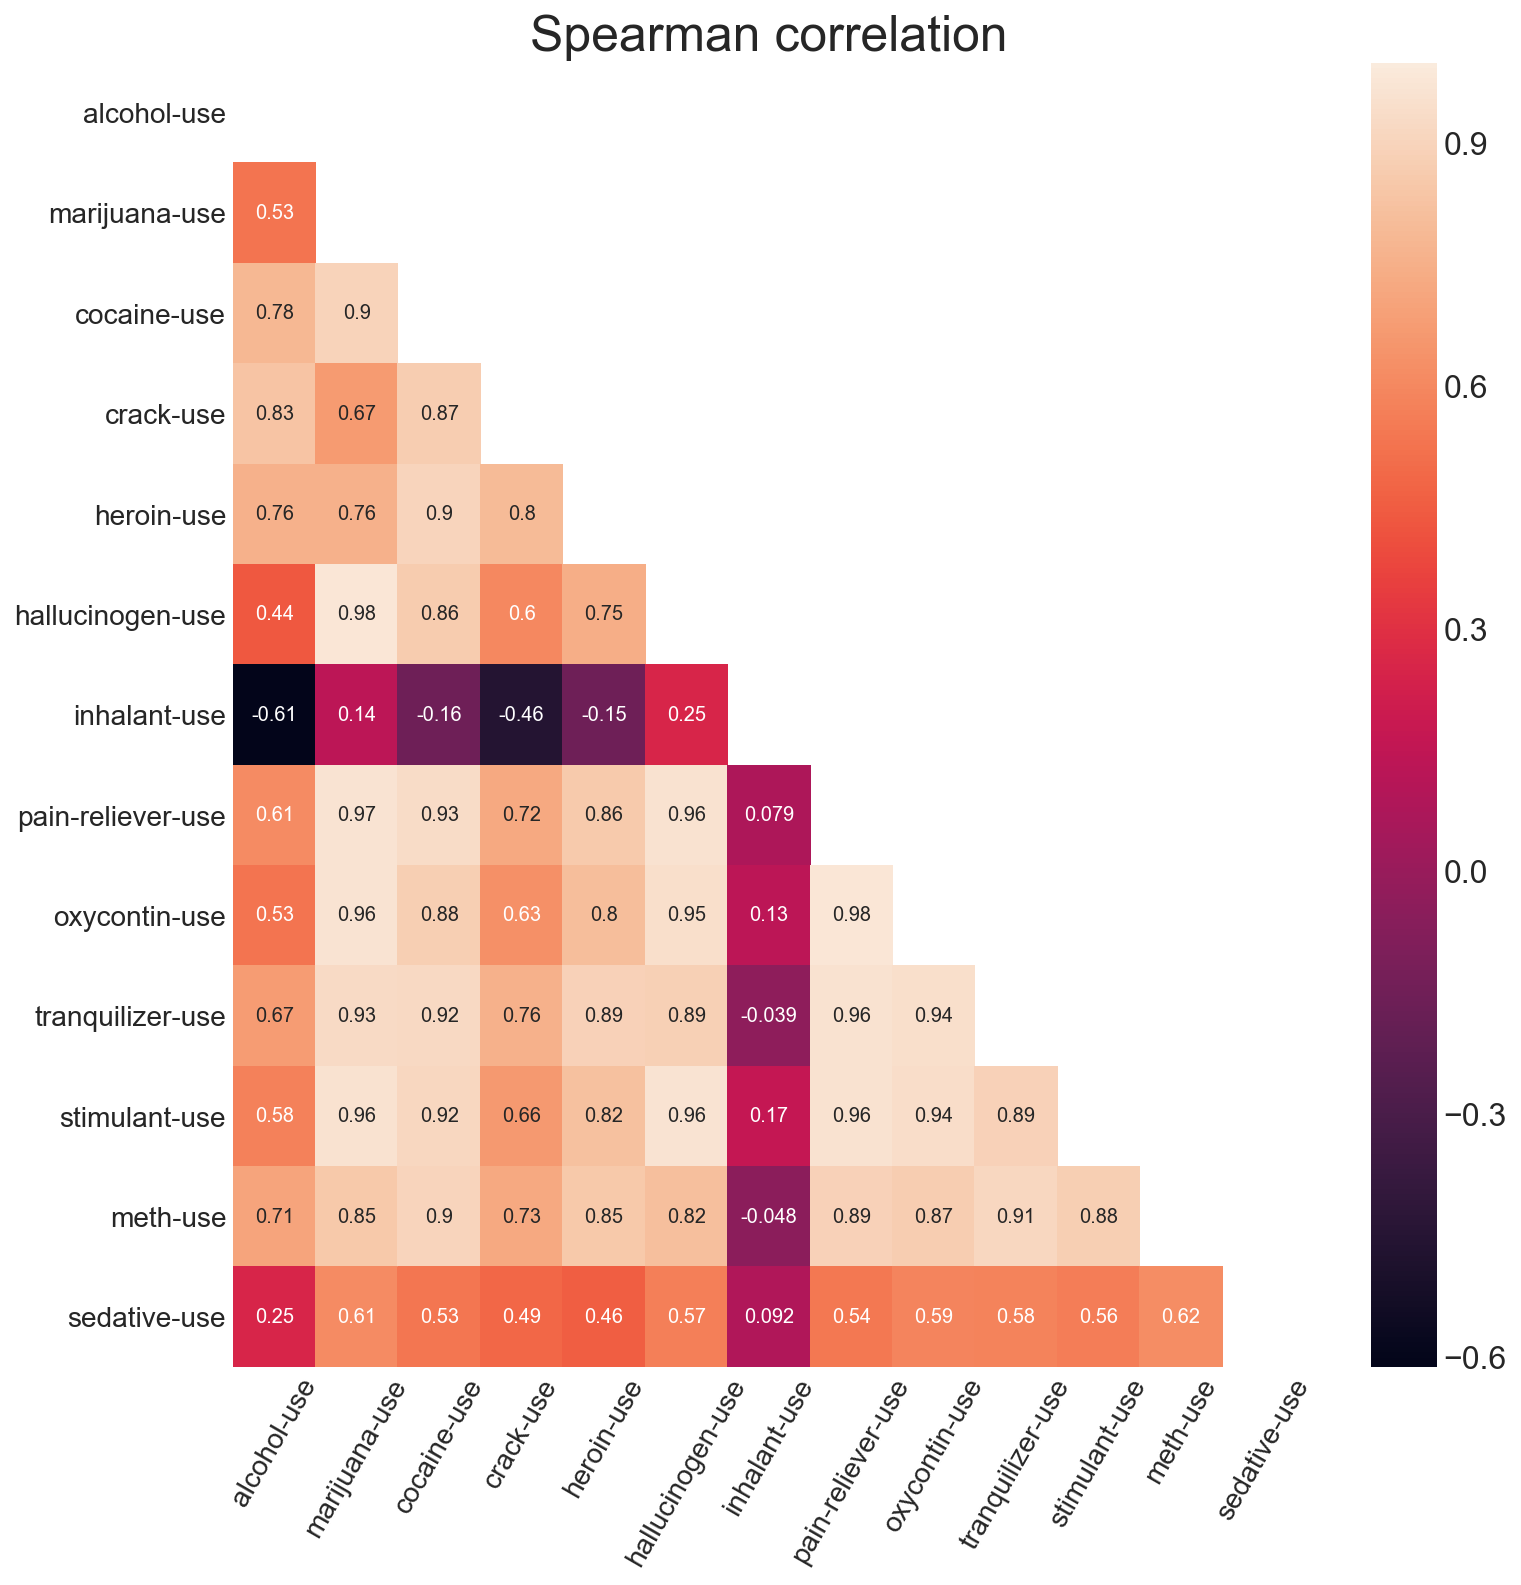
That was the big ‘WOW’ moment for me. To varying degrees, all of the other drugs appear to have positive correlations, but not inhalants.
And it got me thinking…
Null hypothesis: There is no or a positive relationship between those using inhalants and those that are not.
Alternative hypothesis: There is a negative relationship between the group that use inhalants and those that are not.
Some additional research
Before I started testing my hypothesis, I wanted to read up a little more about inhalants as my prior knowledge was very limited.
Some of what I discovered was things I already knew, like generally inhalants are household items like hairspray or paint, but I also learnt things that I didn’t know before.
I learnt that inhalants affect the body like alcohol, but they are much faster than alcohol. The high that users get from inhalants only lasts a couple of minutes. And, most importantly (for those using as well as for my research and hypothesis testing) was that using inhalants alongside other drugs like alcohol or opiates is incredibly dangerous. Mixing these can impact a person’s breathing and increases the risk of passing out.
Testing my hypothesis
Back to the task at hand. I was interested in determine if the negative correlation I noted between inhalants and all other drugs was significant enough to feel confident is saying that those that used inhalants don’t use other drugs.
But when I ran a test against the correlation to determine if I could reject the Null hypothesis, the only relationship where the negative correlation was statistically significant was between alcohol and inhalants.
| Drug use | Correlation | p-value |
|---|---|---|
| Alcohol | -0.612646 | 0.008934 |
| Cocaine | -0.156308 | 0.549115 |
| Crack-use | -0.457000 | 0.065151 |
| Hallucinogen | 0.251074 | 0.331028 |
| Heroin | -0.153306 | 0.556909 |
| Marijuana | 0.136196 | 0.602215 |
| Meth | -0.048299 | 0.853952 |
| Oxycontin | 0.133088 | 0.610604 |
| Pain-reliever | 0.079238 | 0.762425 |
| Sedative | 0.091815 | 0.725988 |
| Stimulant | 0.167588 | 0.520275 |
| Tranquilizer | -0.038698 | 0.882772 |
Using the wider accepted threshold of a p-value being less than 0.05, I can see that only alcohol usage and inhalant usage are significantly negatively correlated with one another.
In other words, I am 95% confident that people in the sample population who drink alcohol are less likely to also use inhalants.
Given what my inhalant research uncovered, this makes sense too. Doing both types of drugs can be very dangerous to the user.
Conclusion
So assuming that this data analysis was supposed to yield actionable results, what can be obtained from this?
Well, given that alcohol users and inhalant users are most likely not going to cross over - is there a case for investing in prevention education and rehabilitation programs for both drug user groups?
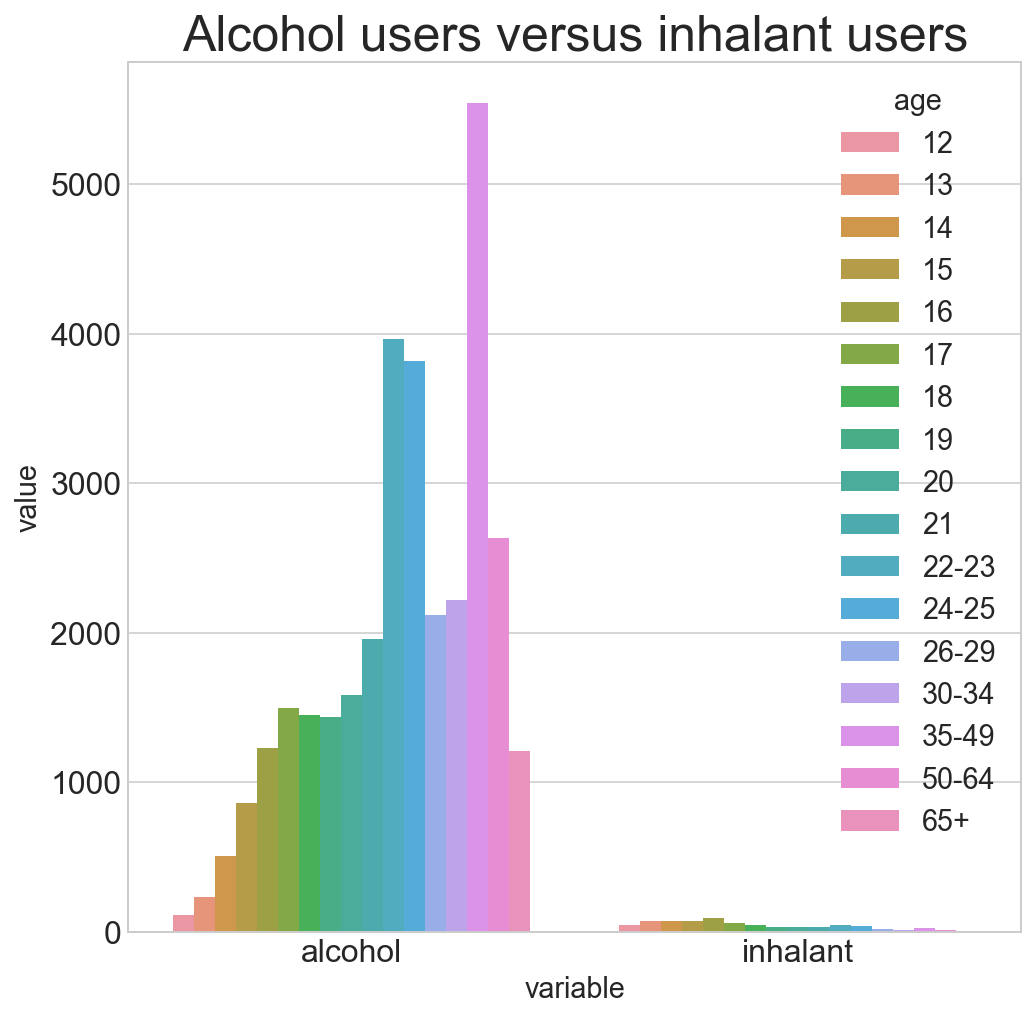
Alcohol user numbers far outweigh inhalant user numbers in this study. If there was only money available to support education and rehabilitation programs for one of these drugs, my suggestion is alcohol.
Sign off
Thanks for reading this far. I hope you enjoyed my analysis of the Center for Behavioral Health Statistics and Quality’s ‘Drug use by Age’ data set.